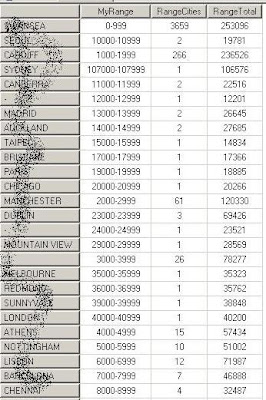
Here is a similar MDX puzzle. The aim is to aggregate members by the range their measure falls into. For example, aggregate cities into ranges (multiples of 1000) of the number of hits.
Of course, you can hand craft the MDX to define each range, but that's not elegant, scalable or flexible. How about some MDX that dynamically creates the ranges?

Here is a solution from my Weblogs database. The query is aggregating the number of hits for all cities with hits in the 0 - 999 range, 1000 - 1999 range etc. See how it uses recursive MDX, very similar to the preceding blog, which aggregates by distinct member_caption. Recursive MDX really is very useful.
Here is what the output looks like. Note; ignore the city name, that is just the last city in the range. The first measure column has the range limit, the second column has the number of cities and the third measure has the total hits for that range.
with
member measures.MyRange as
cstr(round(Measures.Hits/1000,0)*1000)+"-"+cstr(round(Measures.Hits/1000+1,0)*1000-1)
set MyCities as
Order(nonempty([Client Host].[Client Geography].[City],Measures.Hits)
,Measures.MyRange,BASC)
member measures.r as rank([Client Host].[Client Geography],MyCities)
member measures.RangeTot as iif((MyCities.item(Measures.r-2),Measures.MyRange)=Measures.MyRange,
Measures.Hits+(Measures.RangeTot,MyCities.item(Measures.r-2)),
Measures.Hits)
member Measures.RangeTotal as
iif((MyCities.item(Measures.r),Measures.MyRange)=Measures.MyRange,
null,Measures.RangeTot)
select {Measures.MyRange,Measures.RangeTotal} on 0,
nonempty(MyCities,Measures.RangeTotal) on 1
from EasternMining
5 comments:
Nice post on MDX.
On Demonstration application what kind of control have used for rich UI. The webparts has feature to convert to chart to grid. It is amzaing.
Can you share how you achieved this.
Hi Anoop,
Not sure what you are referring to. If you are referring to the demonstrations on http://RichardLees.com.au/sites/demonstrations then the answer for the dashboards is Microsoft PerformancePoint Server 2007. It is a really good tool and will be superceded shortly with Sharepoint 2010.
Hi Richard,
I found you post ,That's good.
But when i try to custom my query,
I didn't find measures.RangeCities.
How can i do ?
vRichard,
This is a good post. I ran across it as I was looking for my similar, but slightly different problem.
I am trying to rank a specific set of members from a given dimension attribute, based on a measure. Then using that measure, create a pre-defined range of those ranks (0-100, 101-1000, 1001-10000, 10001-100000, 100000+). These ranges become my AXIS ROWS. Then for each range, I want to show the measure we ranked by, along with the DISTINCT COUNT of members from the original SET that fell into each range. We're going to be using this MDX inside Reporting Services, so it has to follow certain rules of format (measures in columns, etc.). I'm close on the query, but getting hung up on the DISTINCT COUNT part.
Have you done anything like this?
Hi Ken,
The distinct count should be quite simple. Here's a blog on how to write a distinct count calc.
http://richardlees.blogspot.com.au/2008/10/alternative-to-physical-distinct-count.html
Post a Comment